HarmonyMS
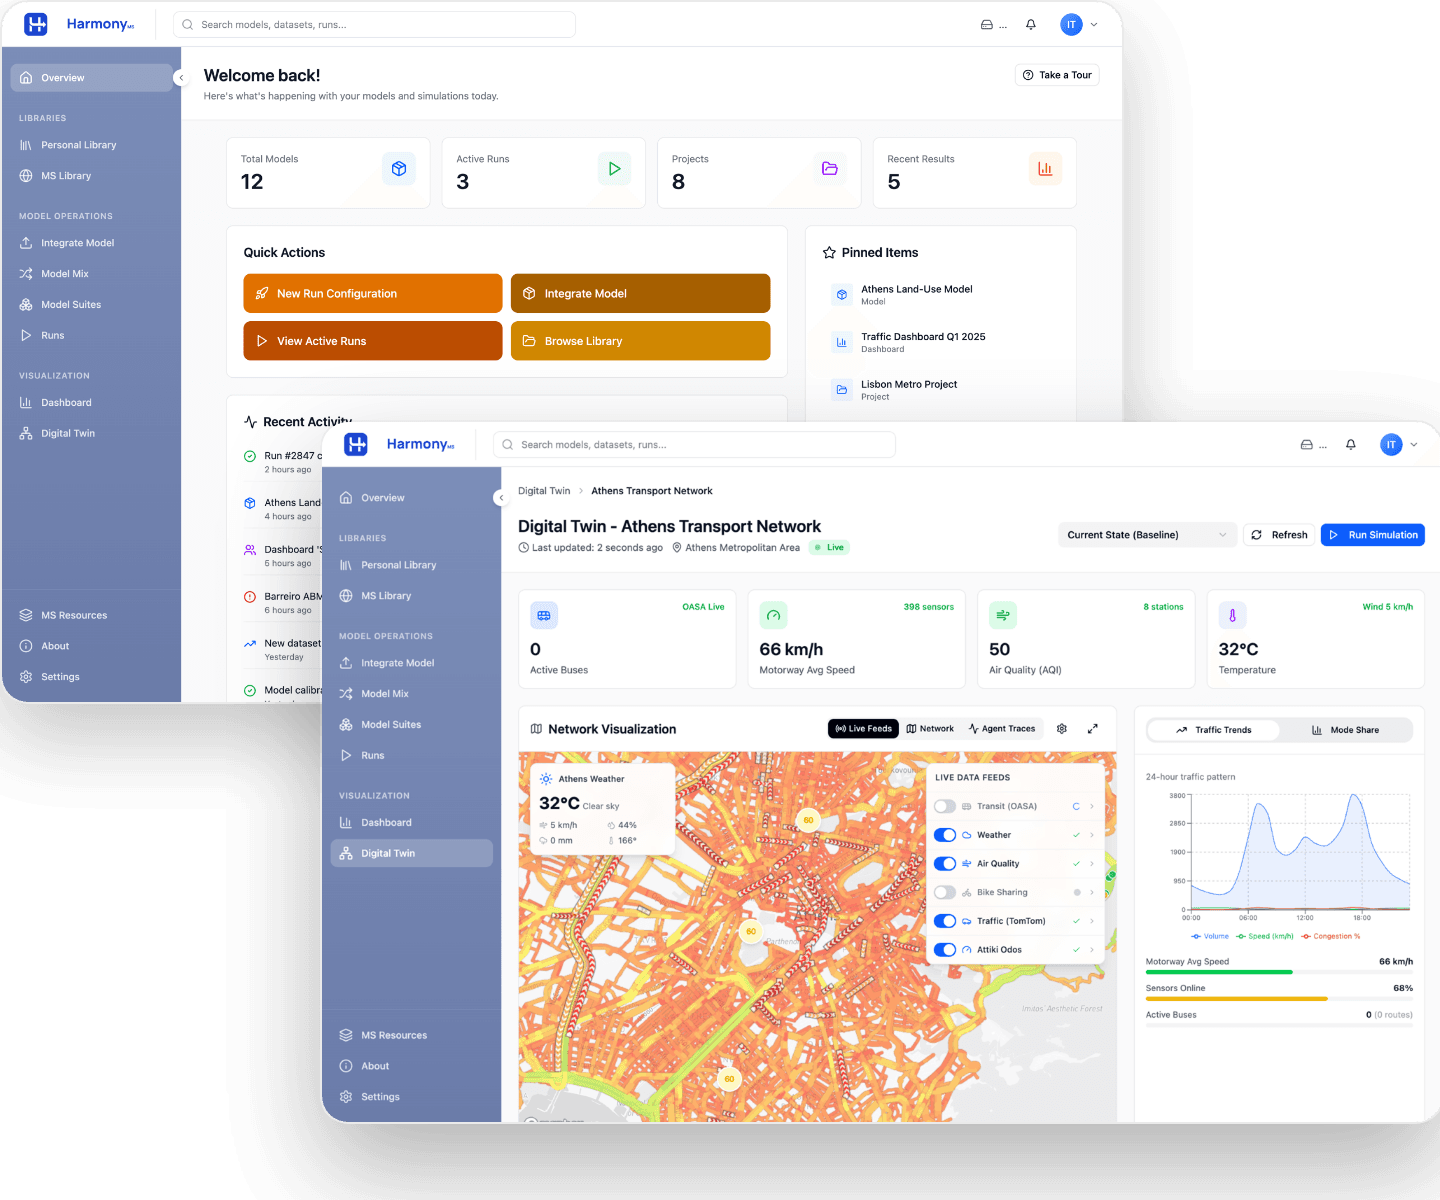
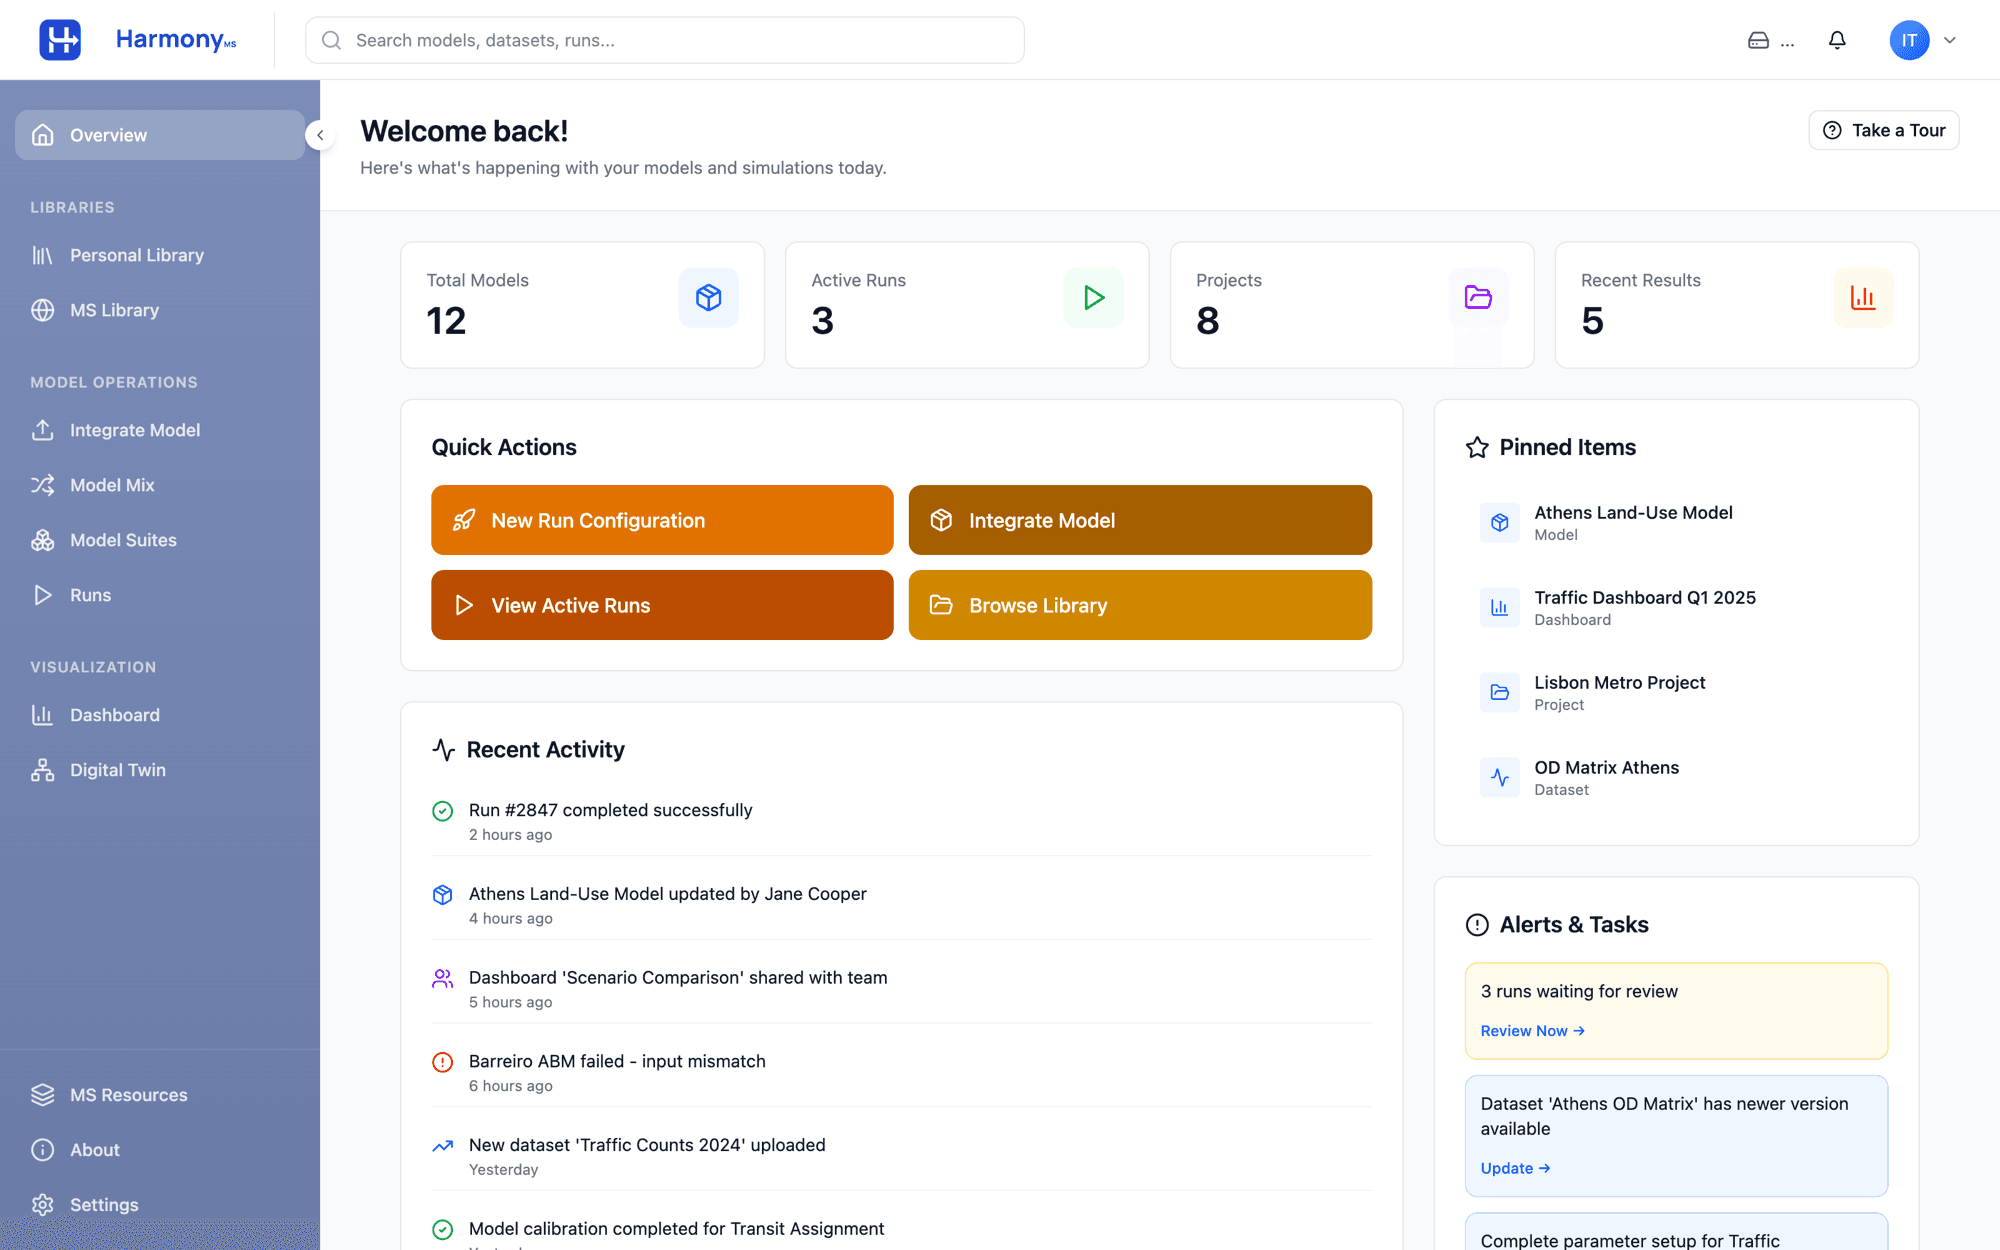
HarmonyMS is a web-based modelling suite for evidence-based planning: integrate the models you already use, assemble them into suites and workflows, run policy scenarios, compare results in interactive dashboards and watch your network live in a digital twin.
Key Capabilities
HarmonyMS equips public authorities, planners, policymakers and researchers with one workspace to integrate models, assemble them into suites and workflows, run scenarios and evaluate outcomes — helping them make smarter, faster and more transparent decisions across transport, land use, sustainability and public policy.

Model Suites and Workflows

Scenario Runs and Dashboards

Live Digital Twin

Model and Data Libraries
Inside the Platform
HarmonyMS covers the full model lifecycle — from onboarding a model to comparing scenarios — in a single web application. Every screen below is the live platform.
Model Suites with Built-in Orchestration
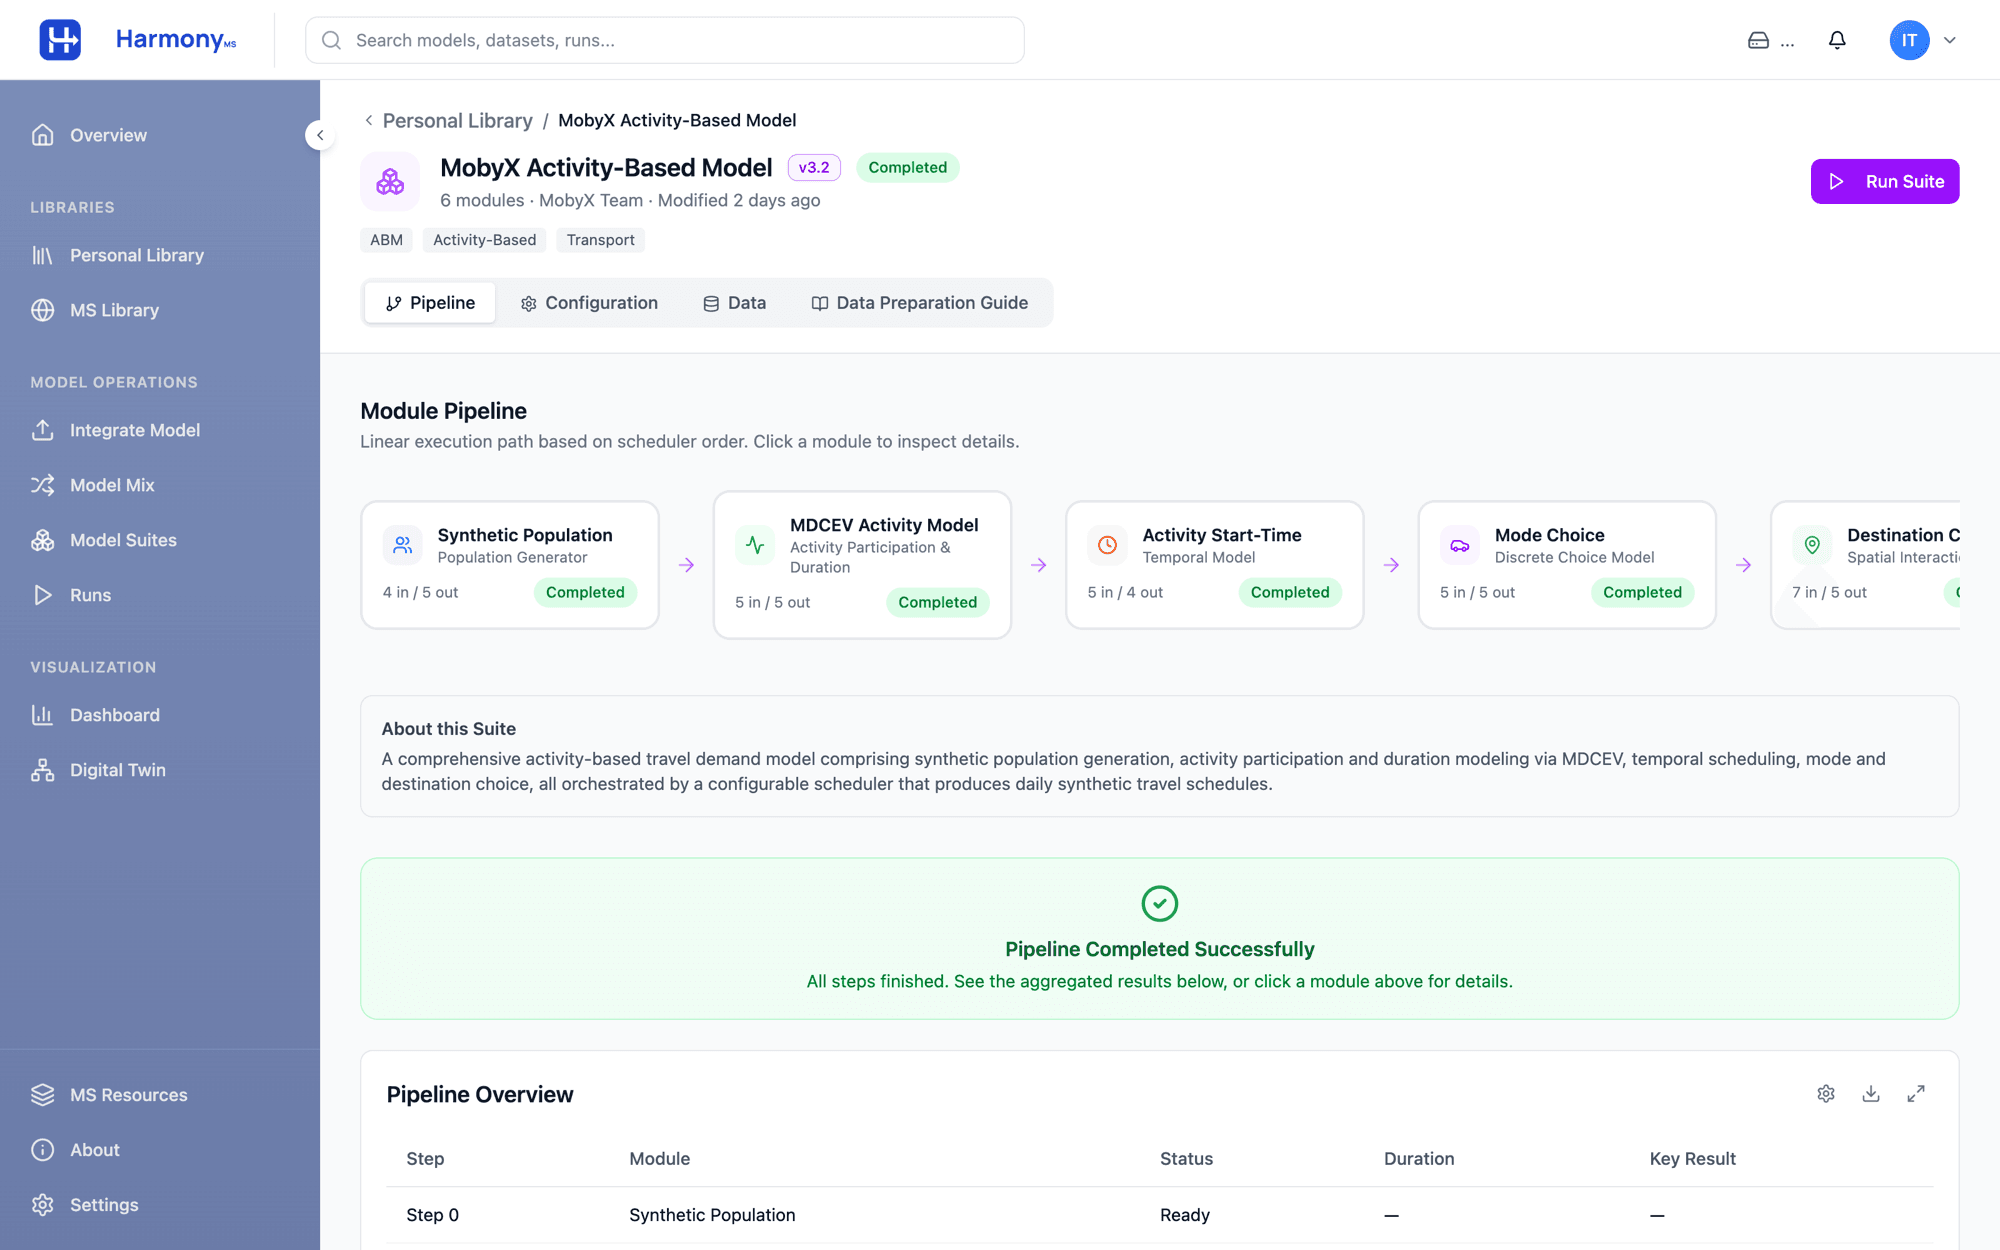
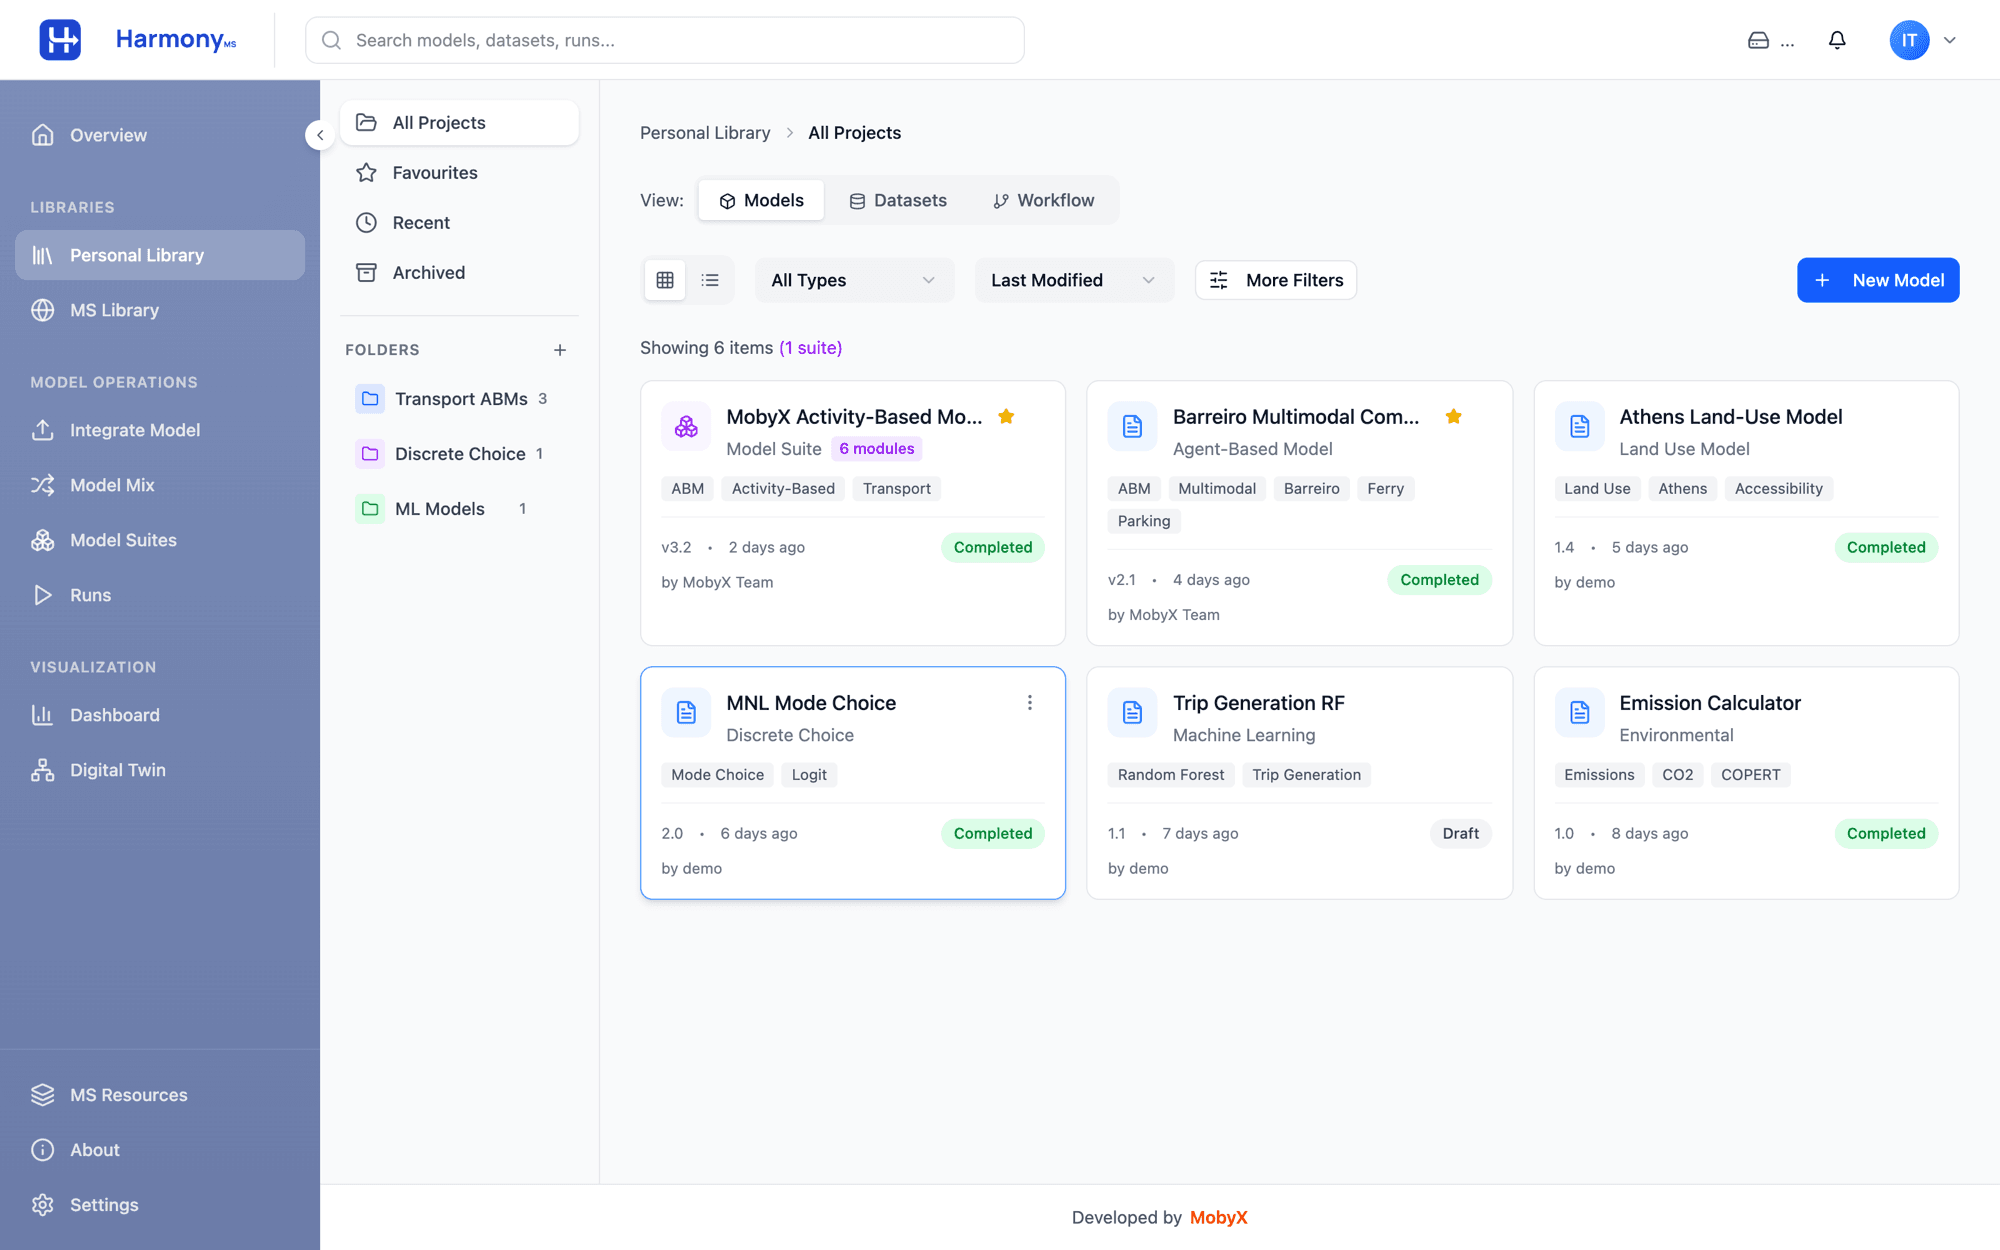
Package related models into a suite with its own internal pipeline. The MobyX Activity-Based Model ships as a six-module suite — synthetic population, MDCEV activity participation, activity start-time, mode choice, destination choice and a scheduler — and runs end to end with data checks and per-module status.
- •
Composite models with typed connections between modules
- •
Ready-made suites: activity-based, classic four-step, freight microsimulation
- •
Data requirements, parameters and datasets managed per suite
Integrate Your Own Models in Five Steps
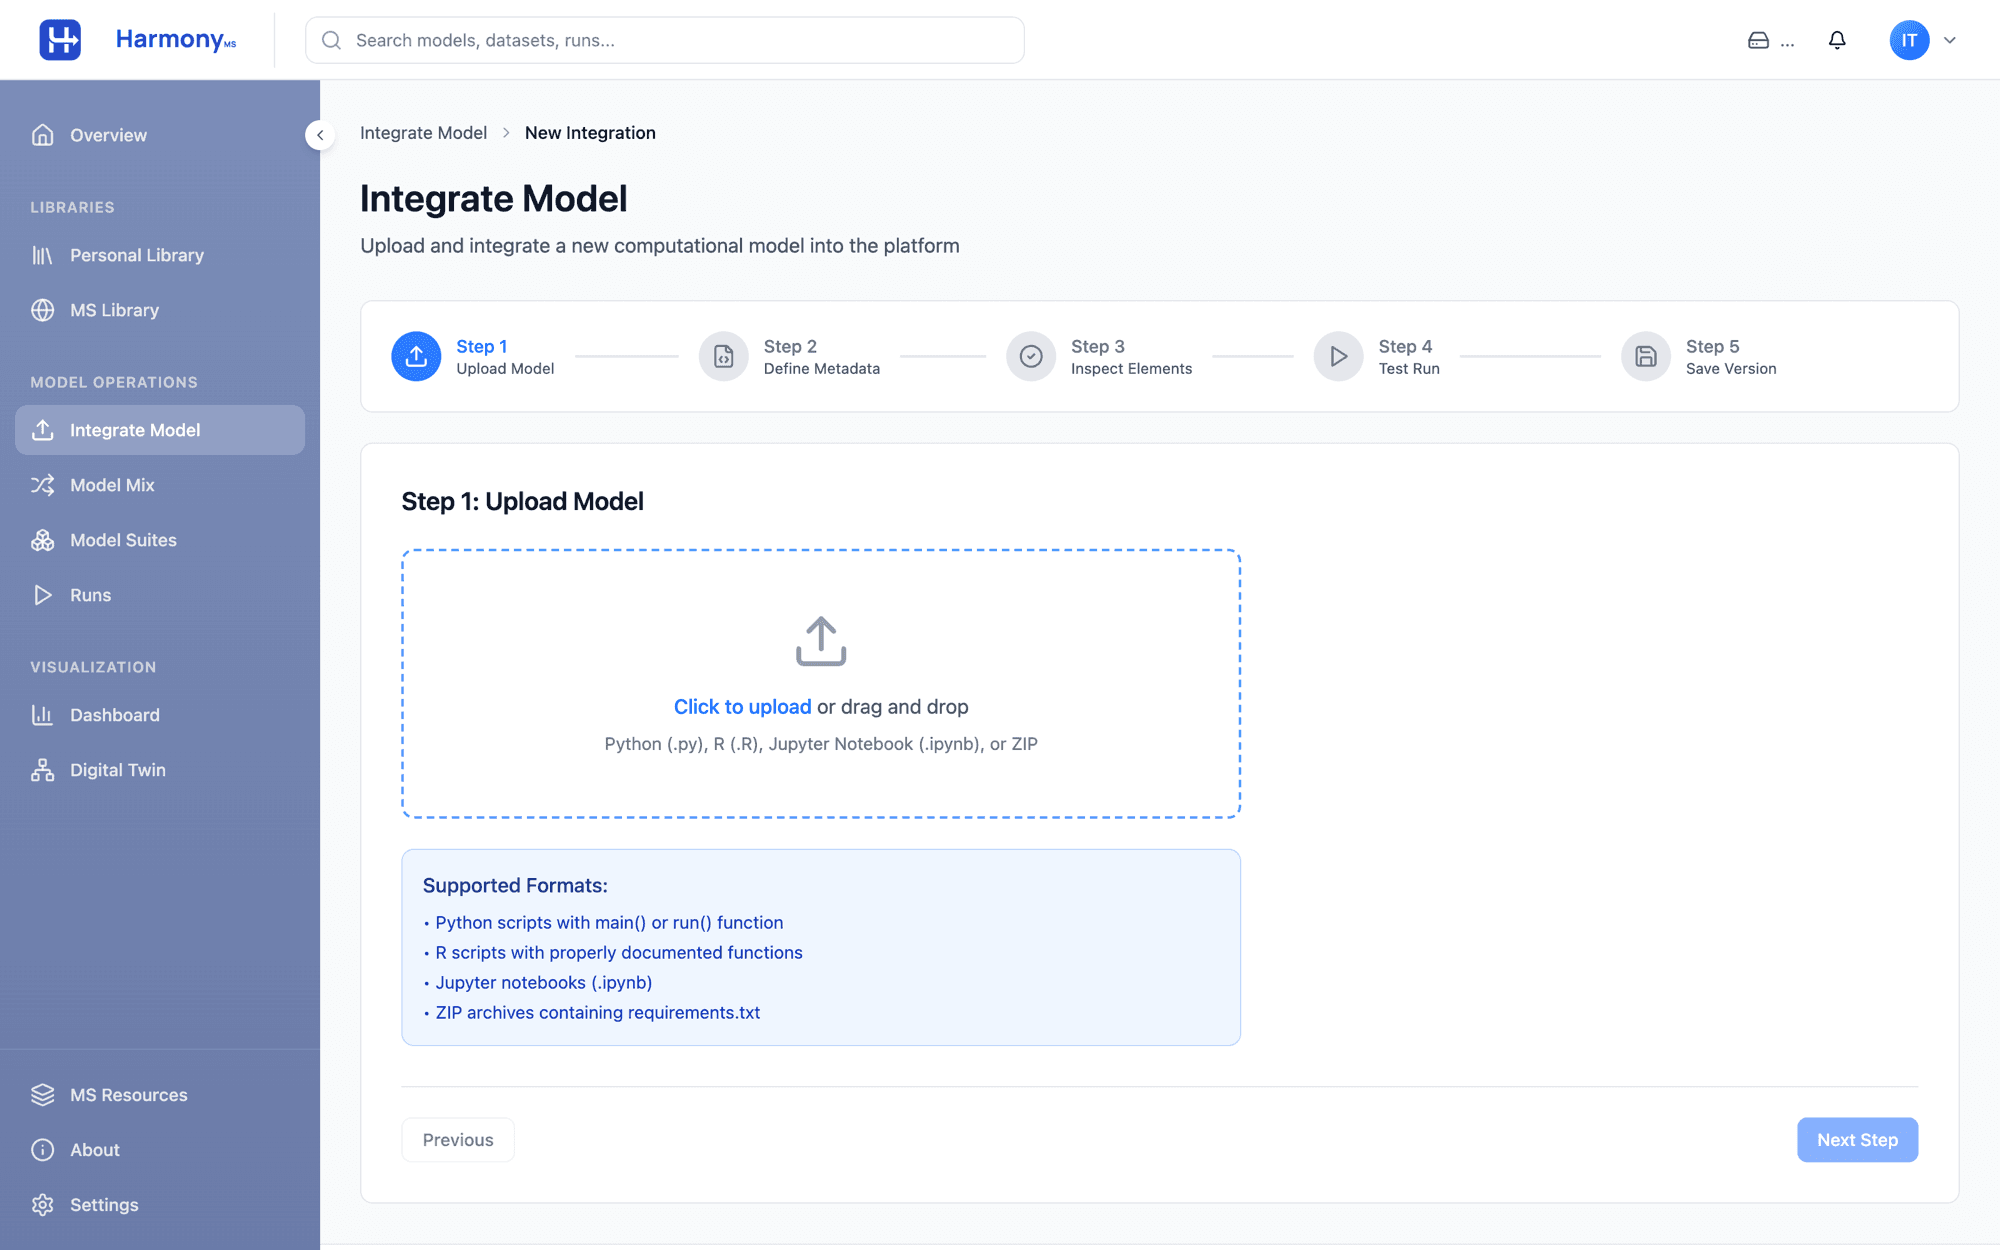
Bring the models you already use — Python, R, Jupyter notebooks or ZIP packages. A guided wizard uploads the model, captures its metadata, inspects inputs and outputs, runs a validation test on a sample dataset and saves a version to your library.
- •
Automatic detection of inputs, outputs and dependencies
- •
Versioning with change comments and rollback
- •
Optional publishing to the shared MS Library
Chain Models into Workflows
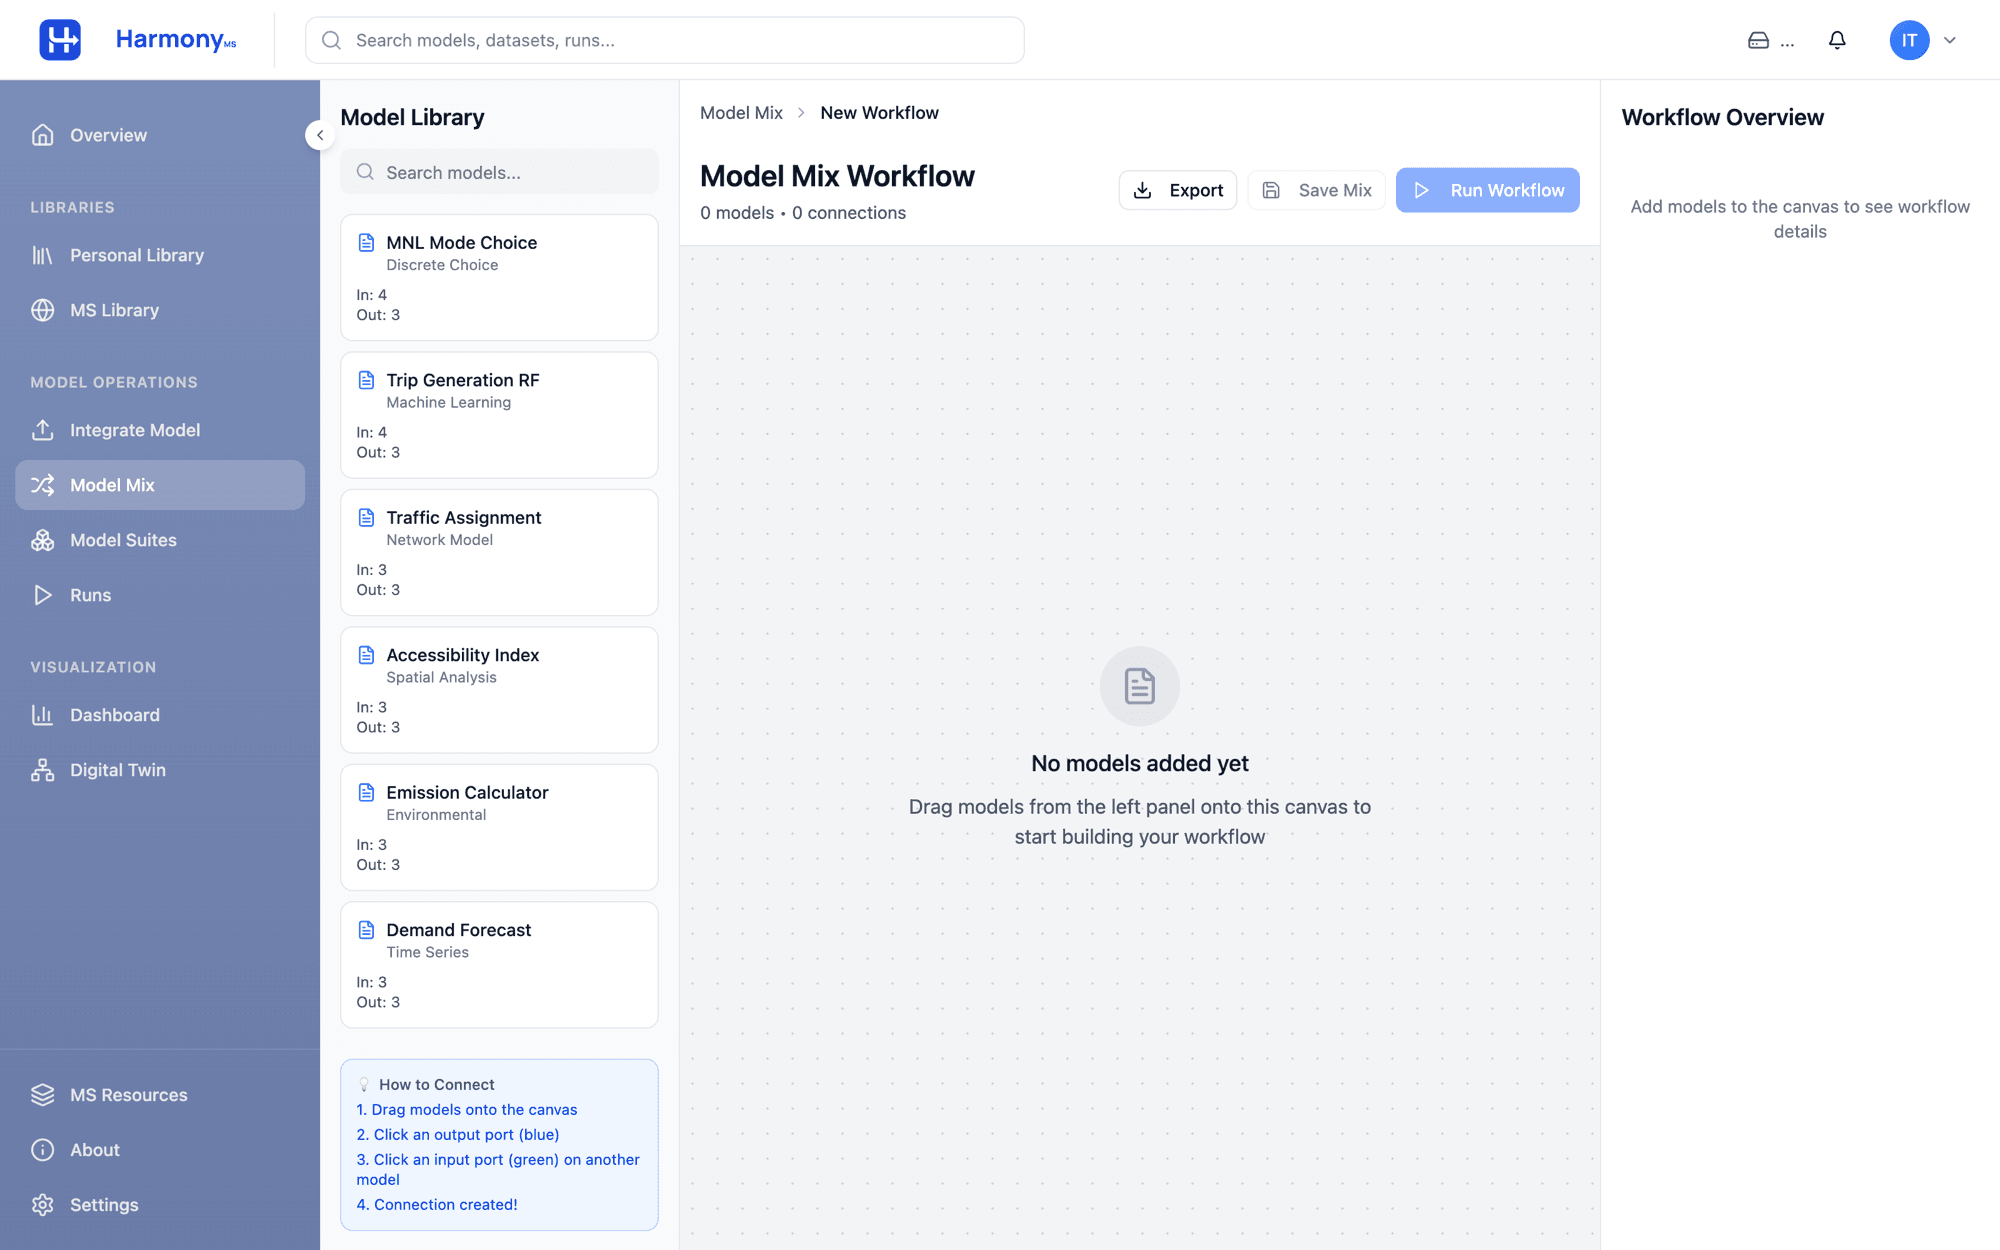
Model Mix is a visual canvas for multi-model workflows. Drag models from your library, connect output ports to input ports and let the platform check compatibility before anything runs. Save the workflow, share it and execute the whole chain in one click.
- •
Drag-and-drop canvas with live compatibility validation
- •
Sequential or branching pipelines across model types
- •
Export and reuse workflows across projects
Configure, Launch and Monitor Runs
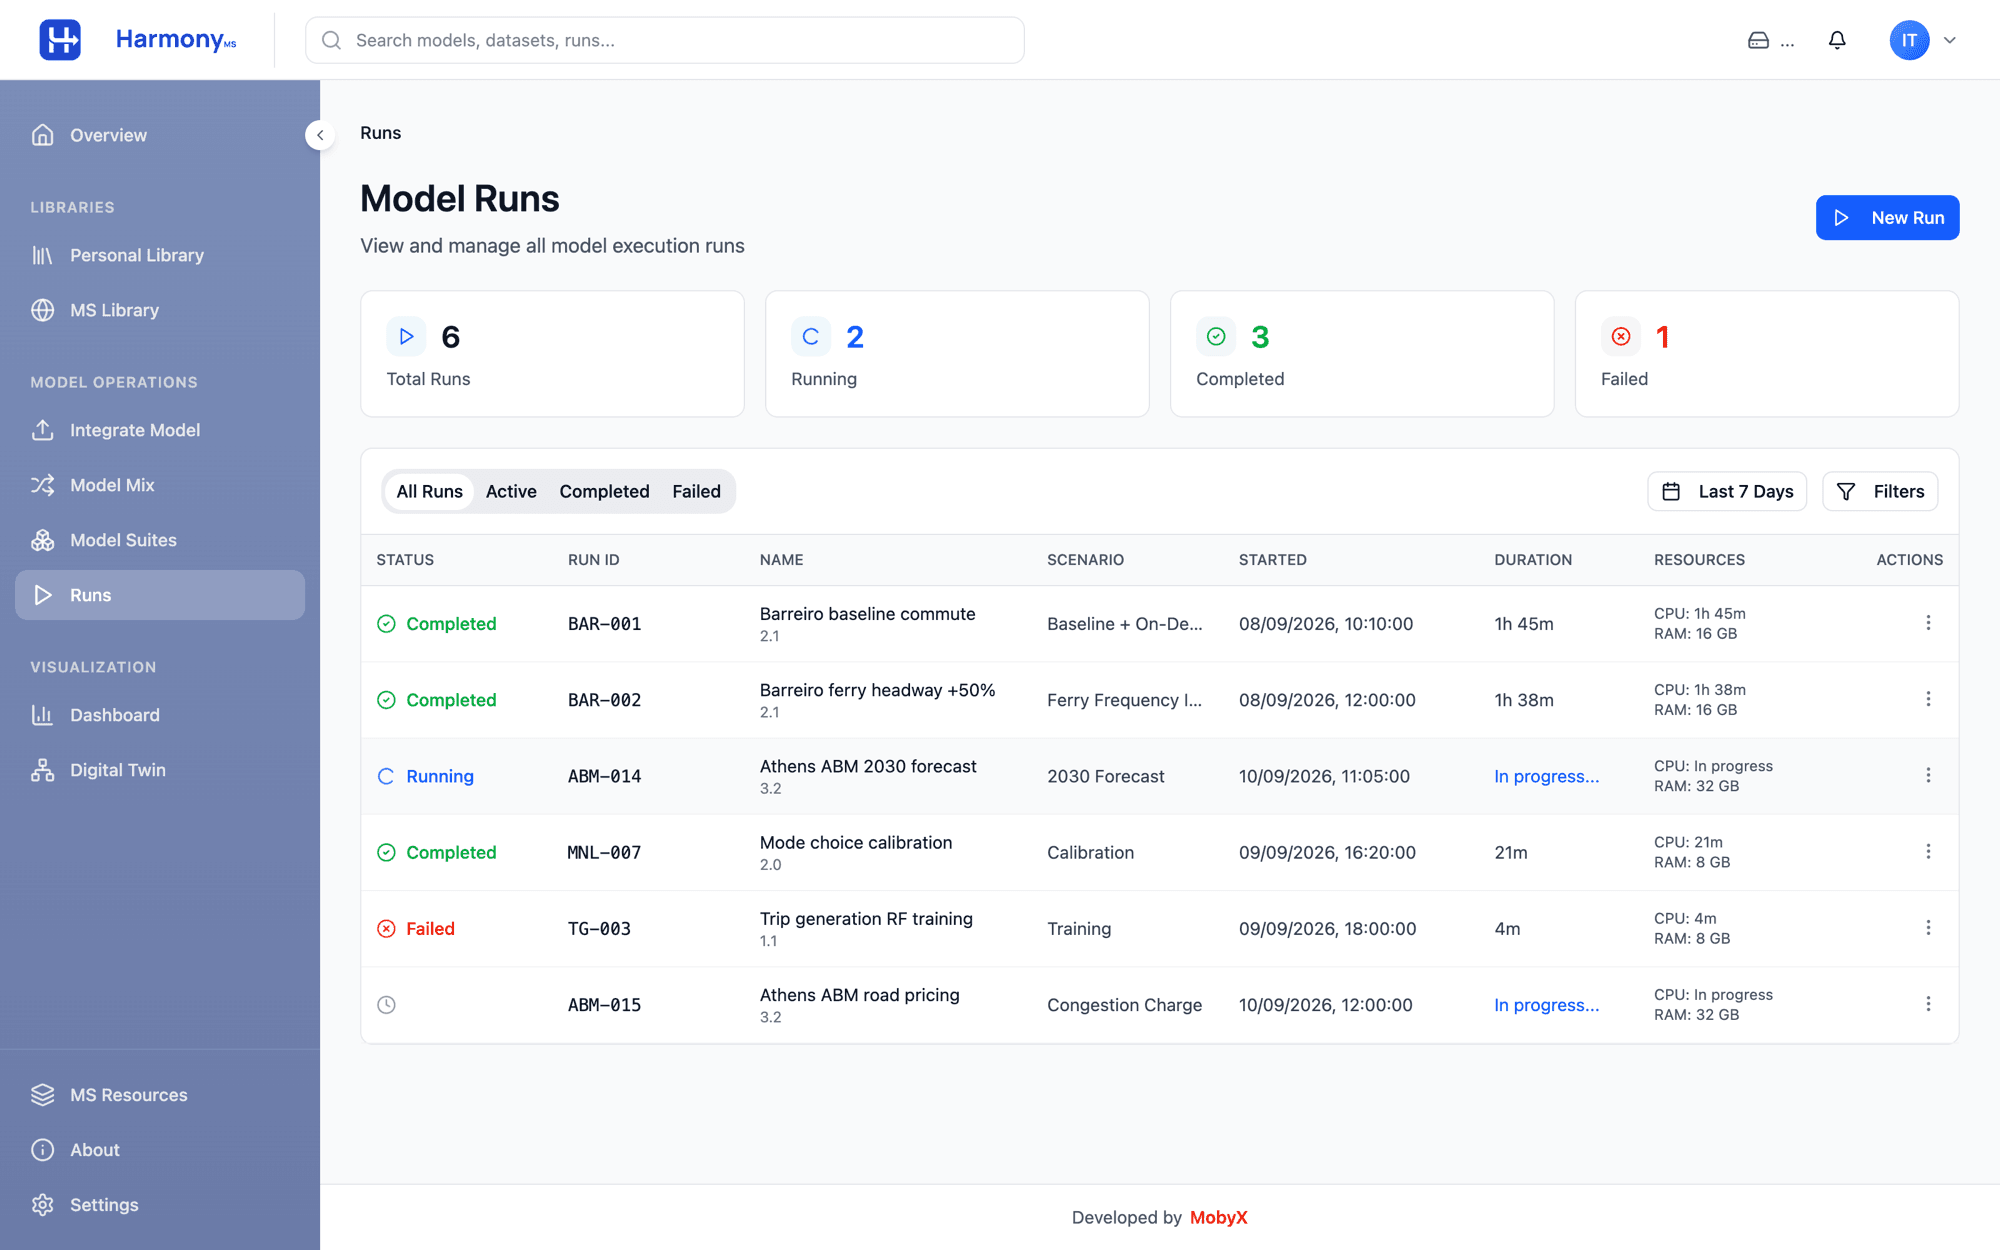
Every run is fully specified: model version, parameters, input datasets, output KPIs and compute resources. Track running, completed and failed executions in one place, with durations, resource usage and one-click access to results.
- •
Dynamic parameter forms generated from the model definition
- •
Run statistics, filters and per-run action menus
- •
Notifications on completion and failure
Results Dashboards and Scenario Comparison
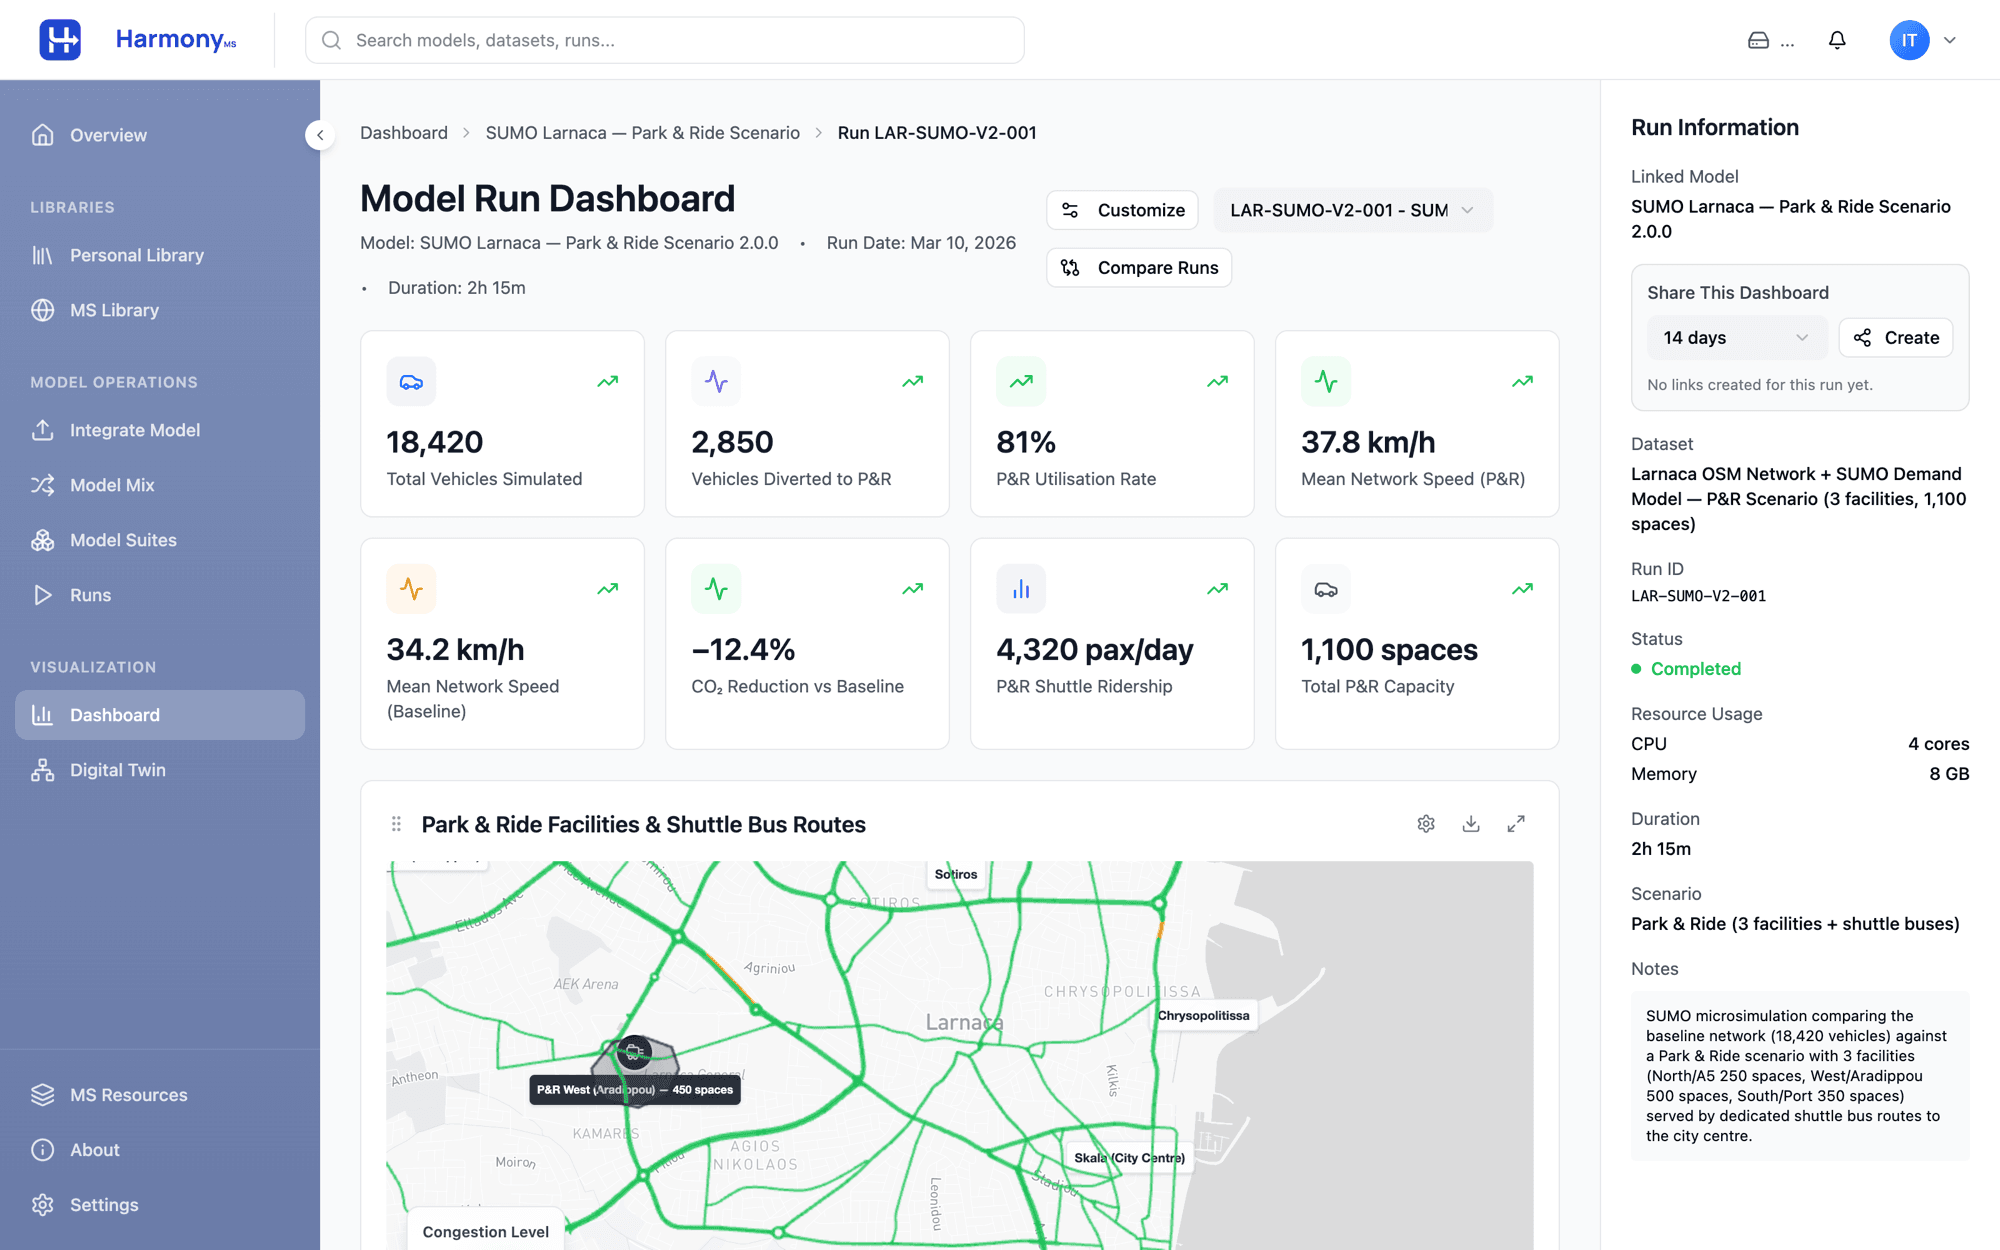
Each completed run opens as an interactive dashboard: KPI cards with baseline deltas, drag-and-drop chart and map panels and full run metadata. Compare two or more runs side by side to quantify the impact of a policy before it becomes reality, and share dashboards through expiring links.
- •
KPI cards, line, bar, area and pie charts, tables and network maps
- •
Multi-run comparison mode with colour-coded overlays
- •
Shareable read-only dashboard links
A Live Digital Twin of the Network
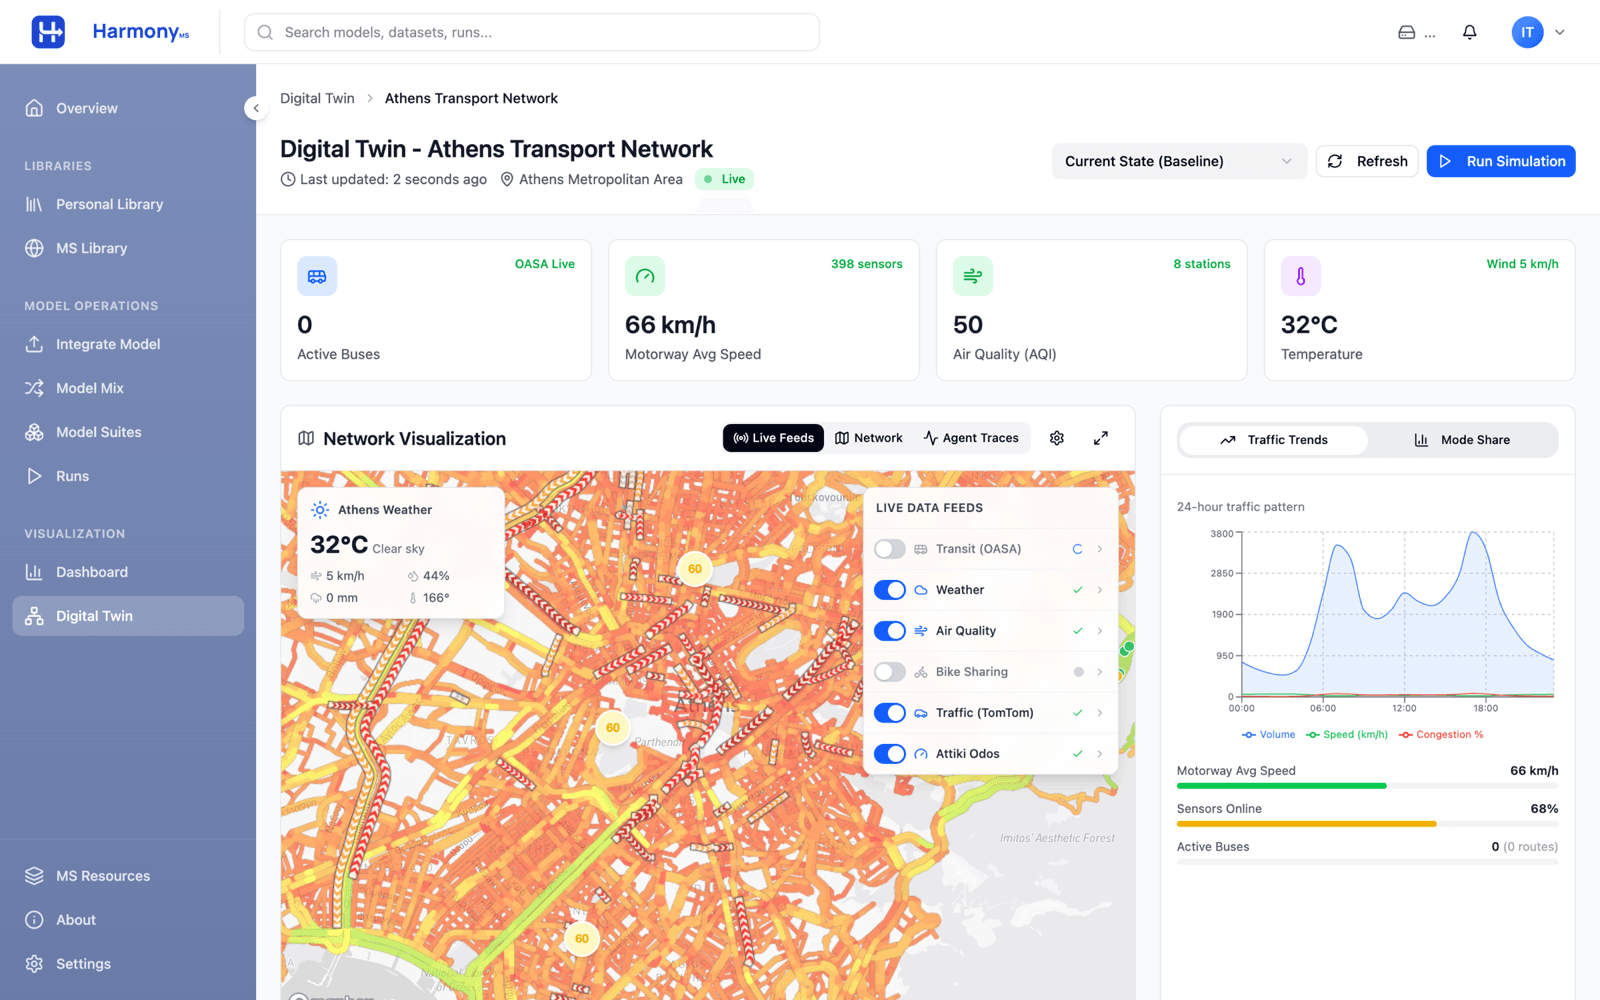
The Digital Twin fuses real-time feeds — public transport telematics, road traffic, air quality, weather, bike sharing and motorway sensors — on an interactive map. Switch between scenarios such as peak hour, major events, road closures or a 2030 forecast, and step through a time-based simulation to see how the network responds.
- •
Live data layers with per-feed toggles and agent traces
- •
Scenario switching with instant KPI, map and chart updates
- •
24-hour traffic trends and mode-share breakdowns
Personal and Shared Libraries
Organise your models, suites and datasets in folders with favourites, tags, versions and status. The MS Library adds community-shared models with ratings, download counts and side-by-side comparison, so teams start from proven components instead of a blank page.
- •
Grid, list and workflow views of your library
- •
Datasets with previews and variable counts
- •
Global search across models, runs and datasets
The Challenge
- •
Models live in separate tools, scripts and notebooks, with no shared way to run or version them
- •
Chaining land-use, demand, network and environmental models is manual and error-prone
- •
Scenario results end up in static reports, so comparing policies takes weeks instead of minutes
- •
Real-time data from transit, traffic and sensors is disconnected from the planning models
- •
Activity-based modelling is powerful but hard to set up, calibrate and reuse in a new city
Why Choose HarmonyMS?

One Workspace for the Whole Model Lifecycle

Ready-Made Activity-Based Model Suite

Network, Service and Microsimulation Models

On-Demand, Shared and Multimodal Scenarios

Works with Python, R, Jupyter, SUMO and Commercial Tools

Cloud-Hosted or Deployed on Your Infrastructure